Kansas's 3rd congressional district
Appearance
| Kansas's 3rd congressional district | |||
|---|---|---|---|
 Kansas's 3rd congressional district – since January 3, 2013. | |||
| Representative |
| ||
| Distribution |
| ||
| Population (2000) | 672,124 | ||
| Median household income | $74,120[1] | ||
| Ethnicity |
| ||
| Cook PVI | R+4[2] | ||
Kansas's 3rd congressional district is a congressional district in the U.S. state of Kansas. Located in eastern Kansas, the district encompasses all of Wyandotte and Johnson counties and parts of Miami county. The district includes the heart of the Kansas side of the Kansas City metropolitan area, including Kansas City, Overland Park, Lenexa, Shawnee, Spring Hill, DeSoto and Olathe.
The district is currently represented by Democrat Sharice Davids, who was first elected in 2018, defeating Republican incumbent Kevin Yoder.
List of members representing the district
[change | change source]District created March 4, 1875.
- Parties
Democratic (5) Populist (3) Republican (16)
| Representative | Party | Years | Cong ress |
District home | Electoral history |
|---|---|---|---|---|---|
 William Ripley Brown |
Republican | March 4, 1875 – March 3, 1877 |
44th | Emporia | Lost renomination |
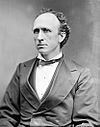 Thomas Ryan |
Republican | March 4, 1877 – March 3, 1885 |
45th 46th 47th 48th |
Topeka | Redistricted to 4th district. |
 Bishop W. Perkins |
Republican | March 4, 1885 – March 3, 1891 |
49th 50th 51st |
Parsons | Redistricted from at-large district. |
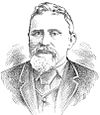 Benjamin H. Clover |
Populist | March 4, 1891 – March 3, 1893 |
52nd | Douglass | [Data unknown/missing.] |
 Thomas J. Hudson |
Populist | March 4, 1893 – March 3, 1895 |
53rd | Fredonia | [Data unknown/missing.] |
 Snyder S. Kirkpatrick |
Republican | March 4, 1895 – March 3, 1897 |
54th | Fredonia | [Data unknown/missing.] |
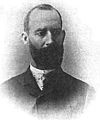 Edwin R. Ridgely |
Populist | March 4, 1897 – March 3, 1901 |
55th 56th |
Girard | [Data unknown/missing.] |
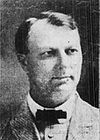 Alfred M. Jackson |
Democratic | March 4, 1901 – March 3, 1903 |
57th | Winfield | [Data unknown/missing.] |
 Philip P. Campbell |
Republican | March 4, 1903 – March 3, 1923 |
58th 59th 60th 61st 62nd 63rd 64th 65th 66th 67th |
Pittsburg | [Data unknown/missing.] |
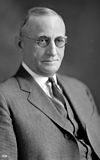 William H. Sproul |
Republican | March 4, 1923 – March 3, 1931 |
68th 69th 70th 71st |
Sedan | [Data unknown/missing.] |
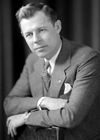 Harold C. McGugin |
Republican | March 4, 1931 – January 3, 1935 |
72nd 73rd |
Coffeyville | [Data unknown/missing.] |
| Edward W. Patterson | Democratic | January 3, 1935 – January 3, 1939 |
74th 75th |
Pittsburg | [Data unknown/missing.] |
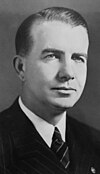 Thomas D. Winter |
Republican | January 3, 1939 – January 3, 1947 |
76th 77th 78th 79th |
Girard | [Data unknown/missing.] |
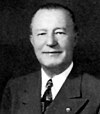 Herbert A. Meyer |
Republican | January 3, 1947 – October 2, 1950 |
80th 81st |
Independence | Died. |
| Vacant | October 2, 1950 – November 7, 1950 |
[Data unknown/missing.] | [Data unknown/missing.] | ||
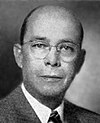 Myron V. George |
Republican | November 7, 1950 – January 3, 1959 |
81st 82nd 83rd 84th 85th |
Altamont | [Data unknown/missing.] |
 Denver D. Hargis |
Democratic | January 3, 1959 – January 3, 1961 |
86th | Coffeyville | [Data unknown/missing.] |
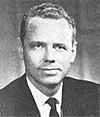 Walter Lewis McVey Jr. |
Republican | January 3, 1961 – January 3, 1963 |
87th | Independence | [Data unknown/missing.] |
 Robert Fred Ellsworth |
Republican | January 3, 1963 – January 3, 1967 |
88th 89th |
Lawrence | Redistricted from the 2nd district. |
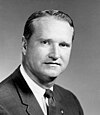 Larry Winn |
Republican | January 3, 1967 – January 3, 1985 |
90th 91st 92nd 93rd 94th 95th 96th 97th 98th |
Prairie Village | [Data unknown/missing.] |
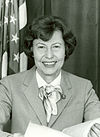 Jan Meyers |
Republican | January 3, 1985 – January 3, 1997 |
99th 100th 101st 102nd 103rd 104th |
Overland Park | [Data unknown/missing.] |
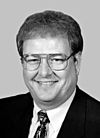 Vince Snowbarger |
Republican | January 3, 1997 –January 3, 1999 | 105th | Olathe | [Data unknown/missing.] |
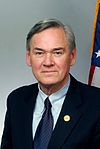 Dennis Moore |
Democratic | January 3, 1999 – January 3, 2011 |
106th 107th 108th 109th 110th 111th |
Lenexa | [Data unknown/missing.] |
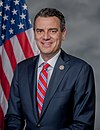 Kevin Yoder |
Republican | January 3, 2011 – January 3, 2019 |
112th 113th 114th 115th |
Overland Park | Lost re-election. |
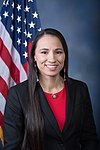 Sharice Davids |
Democratic | January 3, 2019 – Present |
116th | Roeland Park | Elected in 2018. |
Election results from presidential races
[change | change source]| Year | Office | Results | Party that won the district |
|---|---|---|---|
| 2000 | President | George W. Bush 53 - Al Gore 42% | Republican Party |
| 2004 | President | George W. Bush 55 - John Kerry 44% | Republican Party |
| 2008 | President | Barack Obama 51 - John McCain 48% | Democratic Party |
| 2012 | President | Mitt Romney 54 - Barack Obama 46% | Republican Party |
| 2016 | President | Hillary Clinton 47 - Donald Trump 46% | Democratic Party |
Recent Election Results
[change | change source]2002
[change | change source]| Party | Candidate | Votes | % | |
|---|---|---|---|---|
| Democratic | Dennis Moore* | 107,931 | 50.16 | |
| Republican | Adam Taff | 100,999 | 46.93 | |
| Reform | Dawn Bly | 4,934 | 2.29 | |
| Libertarian | Doug Martin | 1,328 | 0.62 | |
| Total votes | 215,192 | 100.00 | ||
| Turnout | ||||
| Democratic hold | ||||
2004
[change | change source]| Party | Candidate | Votes | % | |
|---|---|---|---|---|
| Democratic | Dennis Moore* | 184,050 | 54.82 | |
| Republican | Kris Kobach | 145,542 | 43.35 | |
| Libertarian | Joe Bellis | 3,191 | 0.95 | |
| Reform | Richard Wells | 2,956 | 0.88 | |
| Total votes | 335,739 | 100.00 | ||
| Turnout | ||||
| Democratic hold | ||||
2006
[change | change source]| Party | Candidate | Votes | % | |
|---|---|---|---|---|
| Democratic | Dennis Moore* | 149,480 | 64.47 | |
| Republican | Chuck Ahner | 78,446 | 33.84 | |
| Reform | Robert A. Conroy | 3,925 | 1.69 | |
| Total votes | 231,851 | 100.00 | ||
| Turnout | ||||
| Democratic hold | ||||
2008
[change | change source]| Party | Candidate | Votes | % | |
|---|---|---|---|---|
| Democratic | Dennis Moore* | 202,541 | 56.44 | |
| Republican | Nick Jordan | 142,307 | 39.66 | |
| Libertarian | Joe Bellis | 10,073 | 2.81 | |
| Reform | Roger Tucker | 3,937 | 1.10 | |
| Total votes | 358,858 | 100.00 | ||
| Turnout | ||||
| Democratic hold | ||||
2010
[change | change source]| Party | Candidate | Votes | % | |||
|---|---|---|---|---|---|---|
| Republican | Kevin Yoder | 136,246 | 58.40 | |||
| Democratic | Stephene Moore | 90,193 | 38.66 | |||
| Libertarian | Jasmin Talbert | 6,846 | 2.94 | |||
| Total votes | 233,285 | 100.00 | ||||
| Turnout | ||||||
| Republican gain from Democratic | ||||||
2012
[change | change source]| Party | Candidate | Votes | % | |
|---|---|---|---|---|
| Republican | Kevin Yoder (incumbent) | 201,087 | 68.5 | |
| Libertarian | Joel Balam | 92,675 | 31.5 | |
| Total votes | 293,762 | 100 | ||
| Republican hold | ||||
2014
[change | change source]| Party | Candidate | Votes | % | |
|---|---|---|---|---|
| Republican | Kevin Yoder (incumbent) | 134,493 | 60.02 | |
| Democratic | Kelly Kultala | 89,584 | 39.98 | |
| Total votes | 224,077 | 100 | ||
| Republican hold | ||||
2016
[change | change source]| Party | Candidate | Votes | % | |
|---|---|---|---|---|
| Republican | Kevin Yoder (incumbent) | 176,022 | 51.3 | |
| Democratic | Jay Sidie | 139,300 | 40.6 | |
| Libertarian | Steve Hohe | 27,791 | 8.1 | |
| Total votes | 343,113 | 100 | ||
| Republican hold | ||||
2018
[change | change source]| Party | Candidate | Votes | % | |||
|---|---|---|---|---|---|---|
| Democratic | Sharice Davids | 164,253 | 53.3 | |||
| Republican | Kevin Yoder (incumbent) | 136,104 | 44.2 | |||
| Libertarian | Chris Clemmons | 7,643 | 2.5 | |||
| Total votes | 308,000 | 100 | ||||
| Democratic gain from Republican | ||||||
Historical district boundaries
[change | change source]
Related pages
[change | change source]References
[change | change source]- ↑ "My Congressional District".
- ↑ "Partisan Voting Index – Districts of the 115th Congress" (PDF). The Cook Political Report. April 7, 2017. Archived from the original (PDF) on June 7, 2017. Retrieved April 7, 2017.
